Half Year Portfolio Catch-up
Where we are at, and where we're going
Time flies and in the blink of an eye over half of 2021 has passed by. The market has been roaring, but how has my portfolio been doing?
Has it matched up with the indexes, or have I been under-performing like most investment funds?
Let’s find out!
A disclaimer
First of all I want to make something clear, 6 months is far too short of a time period to determine if a given investment (or group of investments) is doing well.
Like Ben Graham once said:
“In the short-run, the stock market is a voting machine. Yet, in the long-run, it is a weighing machine.”
Until we are looking at 5+ years of data, or significant underperformance, there is very little chance that we will be able to accurately state that the investment strategy selected is a good one, or not.
That’s why no matter what the results of this half year report are I will not be meaningfully changing my strategy. That’s not to mean I will never change my strategy, only that not enough time has passed for me to determine if its a good strategy or not.
My Current Holdings
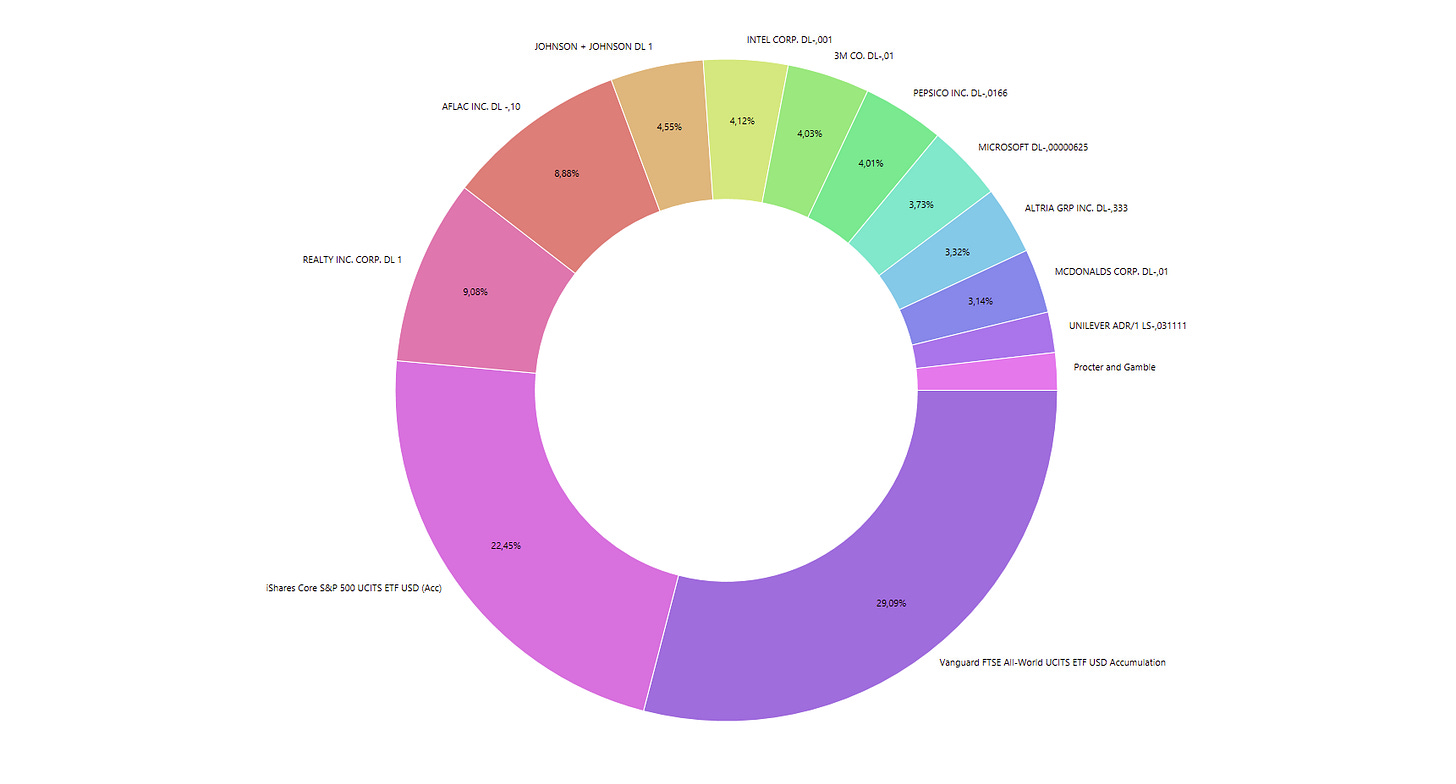
Last time we talked about my full portfolio was a couple of months ago, just after I made significant changes to it.
While the bulk of the portfolio has remained the same, some of the allocations have changed, and we removed one Company (AT&T) and added 2 others, Intel and Altria.
We’ve already talked about Intel, and the reasons for me adding it. Altria on the other hand is my most recent holding, and I haven’t yet discussed it publicly yet, that said, an analysis on it will be coming in later.
So whats the current holdings and their allocations?
In addition to these, I also sold a handful of puts option on some companies I already own, such as Johnson and Johnson, Microsoft and Intel. Selling puts is something I often do in order to collect some premium while waiting to purchase companies at prices that i feel are agreeable to me.
The earnings aren’t particularly high, but if I can get paid 50 dollars to buy Microsoft at $120, why shouldn’t I take advantage of that?
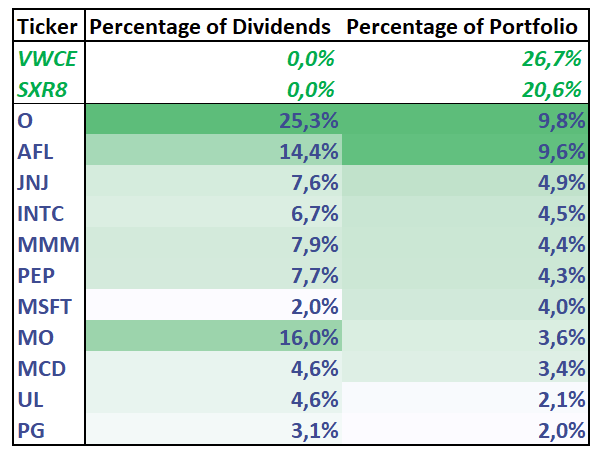
Let’s check these allocations compared to the expected dividends:
Up top in green we have the two Index funds I own, and which comprise a little over half of my portfolio.
One of them is a S&P500 index fund (SXR8) that is provided by Blackrock, and the other is a Vanguard fund that tracks the FTSE All-World index.
Both are wide market low-cost index funds which have a track record of keeping up with the market, and beating most active investing.
I do not plan on increasing my investment in SXR8 due to the fact that I am already overly concentrated in the US market, and I already get sufficient exposure via VWCE, the high unit costs of the ETF also means that it’s unwieldy to buy monthly.
I have no plans to sell my holdings there any time soon, but if I ever feel the need to sell out somewhere, due to purchasing a home or some other big reason, that will likely be what I will sell in order to fund the downpayment.
The rest is my current portfolio and its allocations. You can see the different dividend yields clearly with $MO which will be issuing 16% of my dividends, while only comprising about 3.6% of my portfolio.
$MO is a bit of an outlier though, and most of my holdings have significantly lower yields as you can see.
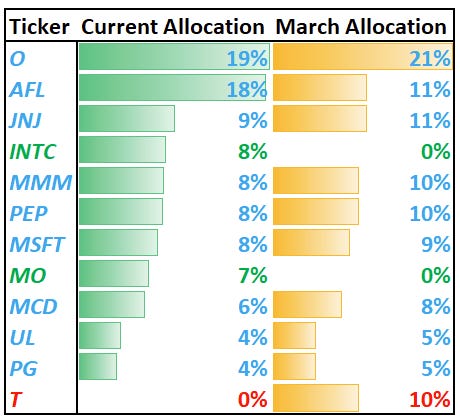
Let’s compare the stock allocation to our initial plan back in early march:
It’s fairly similar, though we can make out some differences.
First of all we have $T in red leaving the portfolio, leaving a 10% gap which was filled (and more!) by the two new entries in Green, $INTC and $MO. Those two and Aflac have been the biggest beneficiaries over these past few months, since that is where the value has been.
Performance
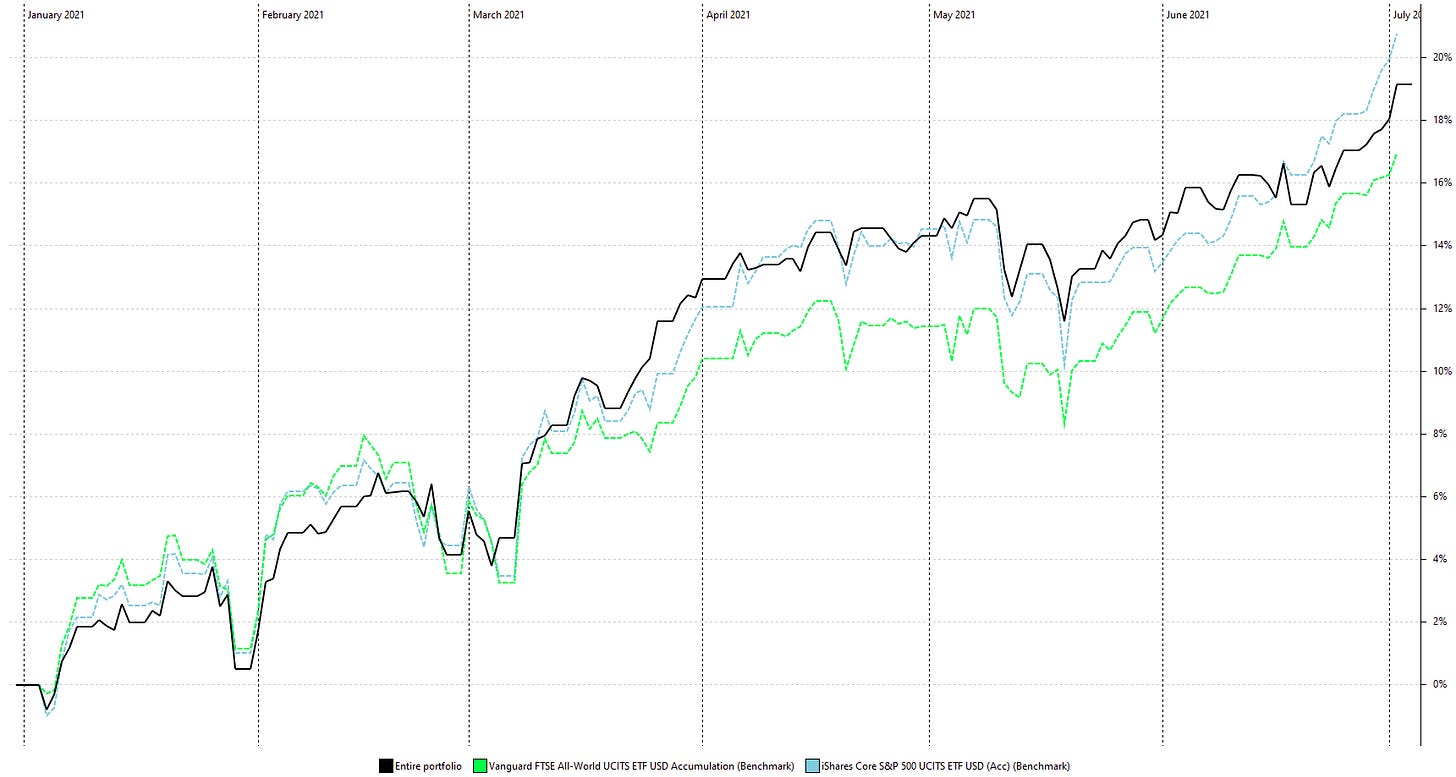
How has my portfolio (and its changes over time) performed however?
Has it beaten “the market”?
For reference we will consider both the S&P500 and the All world index as the benchmarks.
In other words we will be using our low cost index funds as the “benchmarks”, since they comprise roughly 50% of the portfolio, that means any out performance (or under-performance) will be the result of the individual stock picks (or of the specific allocation to a particular index).
To be perfectly honest, I’m keeping the S&P500 as a benchmark primarily due to its prestige and the wide availability of historical data. Due to the higher diversification of the FTSE All-World index I believe that is a better benchmark than a purely american index.
So, have I outperformed? The answer is “sorta”.
I’ve kept pace with the market throughout the year, which makes sense when you consider that half of the portfolio is simply tracking both the benchmarks.
That said I consistently outperformed the FTSE All-World benchmark, and up to the last couple of weeks was regularly beating the S&P500 since early march. Given that I’m being “dragged down” by VWCE which is my largest holding and which is tracking the FTSE All-World index, I would say I did a fair job.
Ultimately though, I don’t believe this slight under-performance of the all-world index means anything. 6 months is too little time to tell.
Overall, I’m satisfied with my performance, and I hope to be able to keep it up over the next 5 years.
Dividends
Finally, let’s talk about dividends.
As you know, from the very beginning my portfolio was focused on dividends as a form of receiving income from the companies I own, that was the case last year before my portfolio was significantly changed, and its the case now that I am satisfied with my allocations.
So, what has changed in terms of dividends compared to 2020? Am I receiving less dividends? More? Has my passive income changed?
In short, yes.
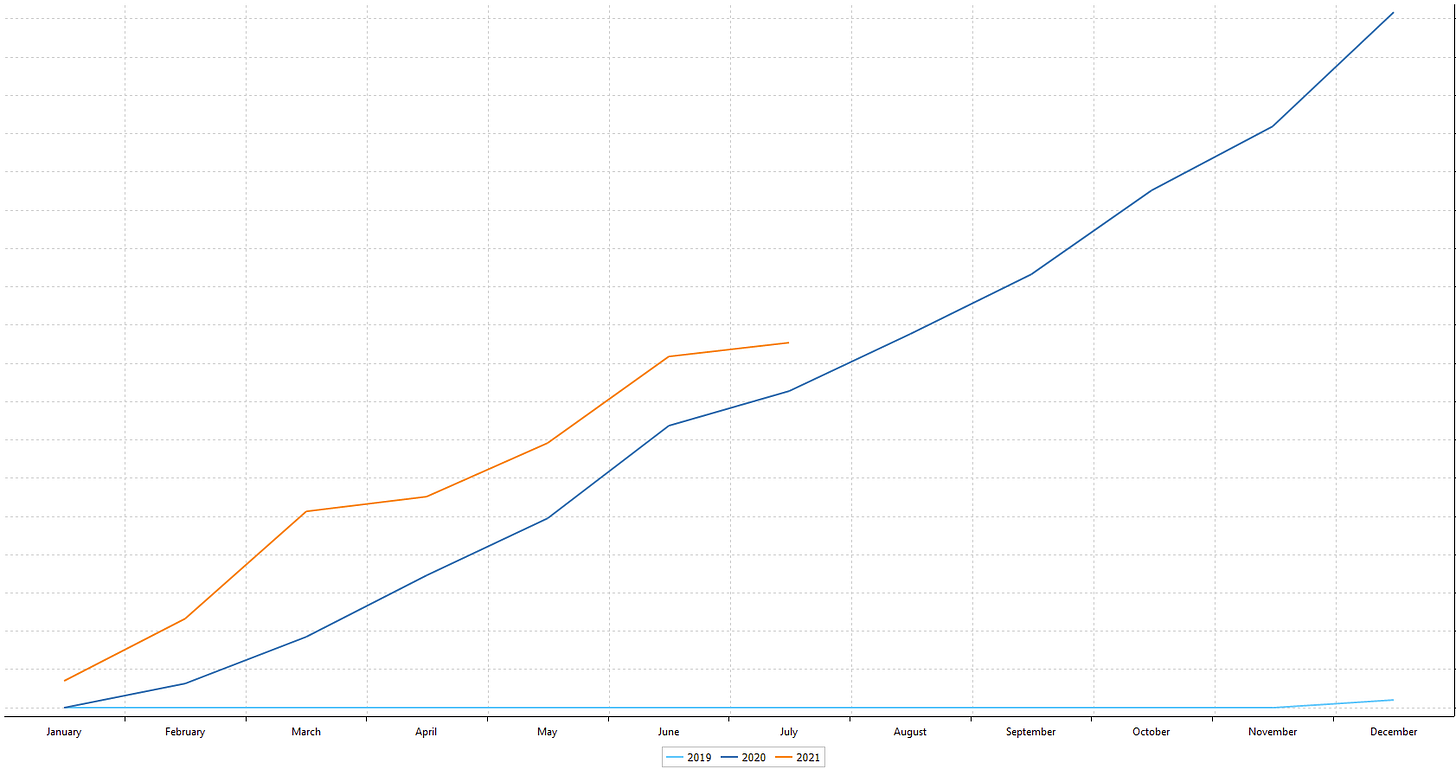
This chart you see is my accumulated gross dividends received since I started investing in the market in November 2019.
As you can see 2021 has started off better than 2020, since unlike last year I actually received some dividends in January. I’ve kept up this momentum throughout the year, which is why I’m still ahead in dividend income received.
That being said, I fully expect that my dividend income will either be reduced or slightly decreased compared to 2020.
The reason is quite simple, my portfolio today is significantly different from this time in 2020, and its yield significantly less. Part of this difference is fairly understandable, in 2020 I held distributing Index Funds, which I’ve since moved away from due to tax reasons.
Given that Index funds make up around half my portfolio, removing their distributions would have cut my income in half had their yield been similar to the rest of my portfolio.
Fortunately the Index Funds I owned did not yield as much as the rest of my portfolio, so the impact, although massive, was not as big as it could have been. That said, around 21.5% of my dividend income becoming zero does have some effects.
In addition to this, my Portfolio re-organization resulted in quite a lot of higher yielder being “let go” and being replaced with lower yielding higher margin of safety companies. Of the top 5 highest payers (and yielders) in 2020, only one remains in my portfolio.
I’m satisfied with the switch, but it did have some impact on my portfolio yield.
What do you think? Is my current portfolio good? Would you change anything about it?
Let me know in the comments down below!
And as always, if you have any questions or comments, shoot them on Twitter @TiagoDias_VC or down below!
And of course, don’t forget to subscribe!


