Last week we talked a bit about 3M, a Dividend King and industrial conglomerate that I currently hold in my portfolio.
We’ve seen the path that this company has taken in the past 10 years, we saw its pluses, its minuses and encountered a few things that make the company a bit unattractive.
The key issue that we saw was an anemic growth in earnings during what was a generalized bull market.
Given that 97% of all stock market returns can be explained by dividend and earnings growth the fact that earnings have not been growing quickly is a significant concern.
That said, I am a firm believer in the idea that every company has a price at which it is worth owning (even if that price is negative!), and so this week we will be comparing 3M with some of it’s competitors, and coming up with a valuation for it.
The Competitors
One of the advantages that 3M has over other corporations, the fact that it is a very diversified conglomerate, also makes it difficult to find companies to compare it against.
3M is a conglomerate with a highly diverse product range, that operates everywhere in the world in multiple market segments, and while there are several other companies with similarly diverse geographical and product range, no company will compete with 3M in every single market segment.
This makes it difficult to decide which companies to pick as comparison, because while company X might compete in Y market, they are entirely absent in Z market. Any choice will necessarily be biased towards one specific market or another.
That being said, there are 2 companies that I feel will be as diversified and multinational as 3M, those are Honeywell and General Electric, and so we will be comparing their performance with 3M.
I chose these 2 companies because they have roughly the same market cap as 3M, they operate in similar (if not the same) market segments, and they too are multinational industrial companies with operations throughout the world.
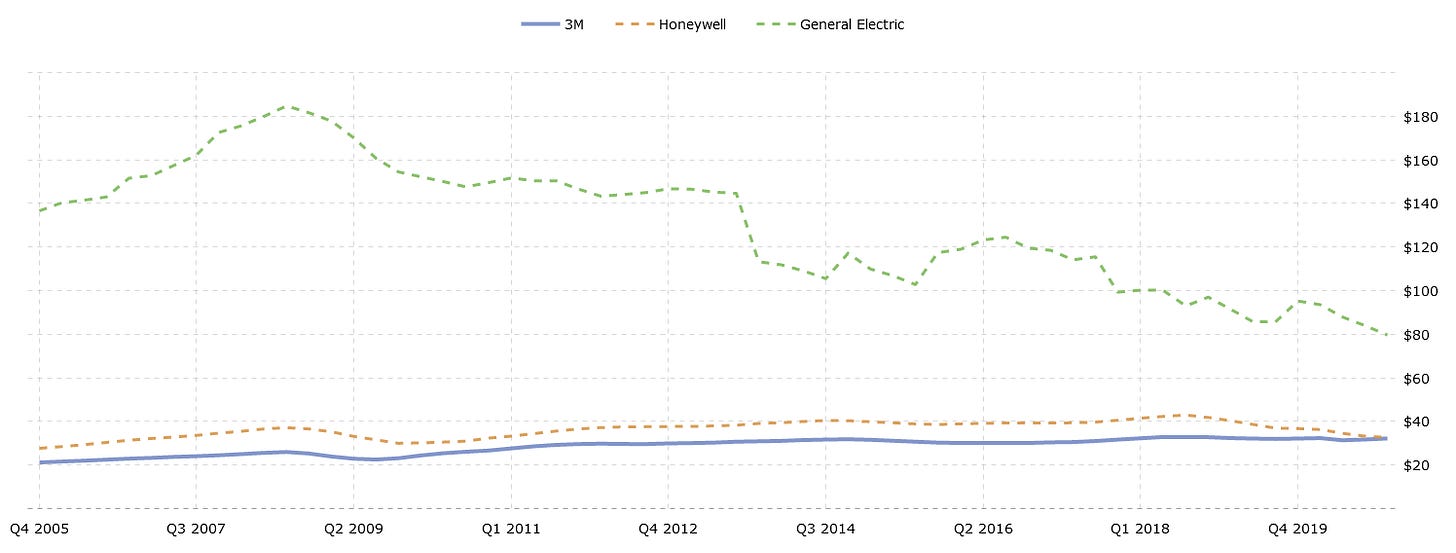
So how do they match up in terms of Revenue?
3M and Honeywell revenue has been slowly but steadily growing, whereas GE has been declining.
I seriously considered as to whether or not to include GE in this comparison due to its well known financial issues, however I chose to leave them in because I don’t feel like intentionally biasing my samples is a good thing to do.
In a way GE serves as proof that things can go wrong with big well established companies, and it would be foolhardy to ignore that.
What about Earnings?
Once again, Honeywell and 3M are very steady and very similar, whereas GE has been quite troubled in the past couple of years.
What about the Ratios?
This is the first time we’ve seen some of these ratios, so let’s break them down a bit.
Return on Assets
Return on Assets is an indicator of how profitable a company is relative to its total assets.
You can generally use it to gauge just how efficient a company is at using its assets to generate earnings.
In this case 3M comes out on top with a 10% average yearly return over the past 3 years. This is lower than the 14% its averaged over the past 10 years, which indicates that in the recent past the company has become less efficient. This is somewhat concerning, but it’s not a deal breaker since it’s still beating the competition.
Return on Equity
Return on Assets is similar to return on assets, however it removes the impact that debt has on its financial performance.
You can use these 2 numbers to estimate just how much leverage a company is using by taking a look at the difference between them. The greater the difference is, the more leveraged a company is.
If we compare it to Honeywell, 3M is a bit more leveraged, which isn’t great, but needs to be taken into consideration alongside the wider context of the company.
Profit Margin
We discussed this measure before, so I will not go into detail about how its calculated or what it means.
It suffices to say that 20+% profit margins are indicative of a durable competitive advantage, and that 3M clearly has something there that makes them a cut above the competition.
That said, on a purely numbers basis Honeywell is also looking quite nice, perhaps we should look into including them into the portfolio at a later stage!
Valuing 3M
Let’s use the 3 methods of valuation that we used with Aflac previously to judge how much 3M is worth, and what we should be willing to pay for it, while maintaining a sufficient margin of safety.
Profit Margin to PE Method
This is a simple method, where we just need to use the following formula:
This method is particularly suited for stable companies with consistent and profitable earnings and margins.
GE will not be suited for this method because it has not been profitable in the past 3 years.
Let’s do this for 3M on the 10 year average, as well as 3M and its competitors over the 3 year average (as well as last year!)
So, out of the 3 companies, 3M is the one with the largest margin of safety, but even then on its best year (last year) it’s got a negative margin of safety of -3%.
So if we were to buy 3M right now we would be slightly overpaying for it. At least we’re not GE though with a whopping -70% margin of safety this company is severely overvalued at the moment, and will need to either improve its earnings and margins significantly or its share price will likely continue to drop.
Ben Grahams Formula(s)
We talked about this with AFLAC before, so I won’t go into the background of the formulas. Suffice to say there are multiple formulas, and we will be using them now.
The original formula is:
Later, he revised the formula to include the effect of interest rates on the stock market:
For the average bond yield we will use the 5 year average AAA Corporate Bond Yield, and for the current yield we will use the current AAA Corporate Bond Yield.
For the growth rate we will use the last 10 years of Compound Growth Rate of Earnings Per Share.
Overall it doesn’t look good like 3Ms current price of $200 is justified according to Ben Graham.
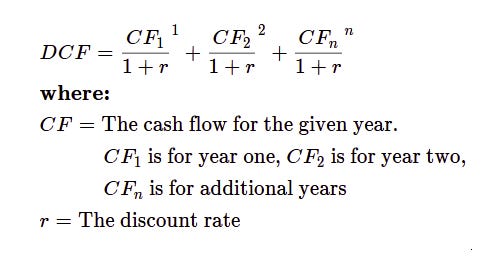
Discounted Cashflow
A Discounted Cash Flow model is a valuation method used to estimate the value of an investment based on its expected future cash flows.
The formula for it is:
We will be using TrackTak, a website with a quick and easy way to create discounted cashflow estimates. While it’s not 100% accurate, it does get us in the general ball park, which is really what we want.
For our inputs we will use:
CAGR = 5%
Target Operating Margin = 22%
Year of Convergence = 10
Sales to Capital Ratio = 1.5
These are all roughly the 10 year averages, so I feel they are decently conservative.
As a result our estimated value per share is $149.31, or about halfway between our PE to Margin formula and Ben Grahams formulas.
The Conclusion
Overall, given a qualitative analysis of the company I would say the fair value of 3M would be around the value estimated via the Discounted Cash Flows method, and I would be open to purchase additional shares at that price.
I feel that such a price would provide sufficient margin of safety to make such an investment profitable.
No matter which valuation model you prefer, it seems that 3M is currently trading either at or above its fair value.
At this time, given the current price of around $200, I do not believe there is sufficient margin of safety to justify significant investments into 3M. That being said, 3M is not sufficiently overvalued to justify selling ones existing position.
There is still one thing missing from 3M though, and that is its story, which we will go over next week!
Let me know what you think!
And as always, if you have any questions or comments, shoot them on Twitter @TiagoDias_VC or down below!
I’ll see you next time!


